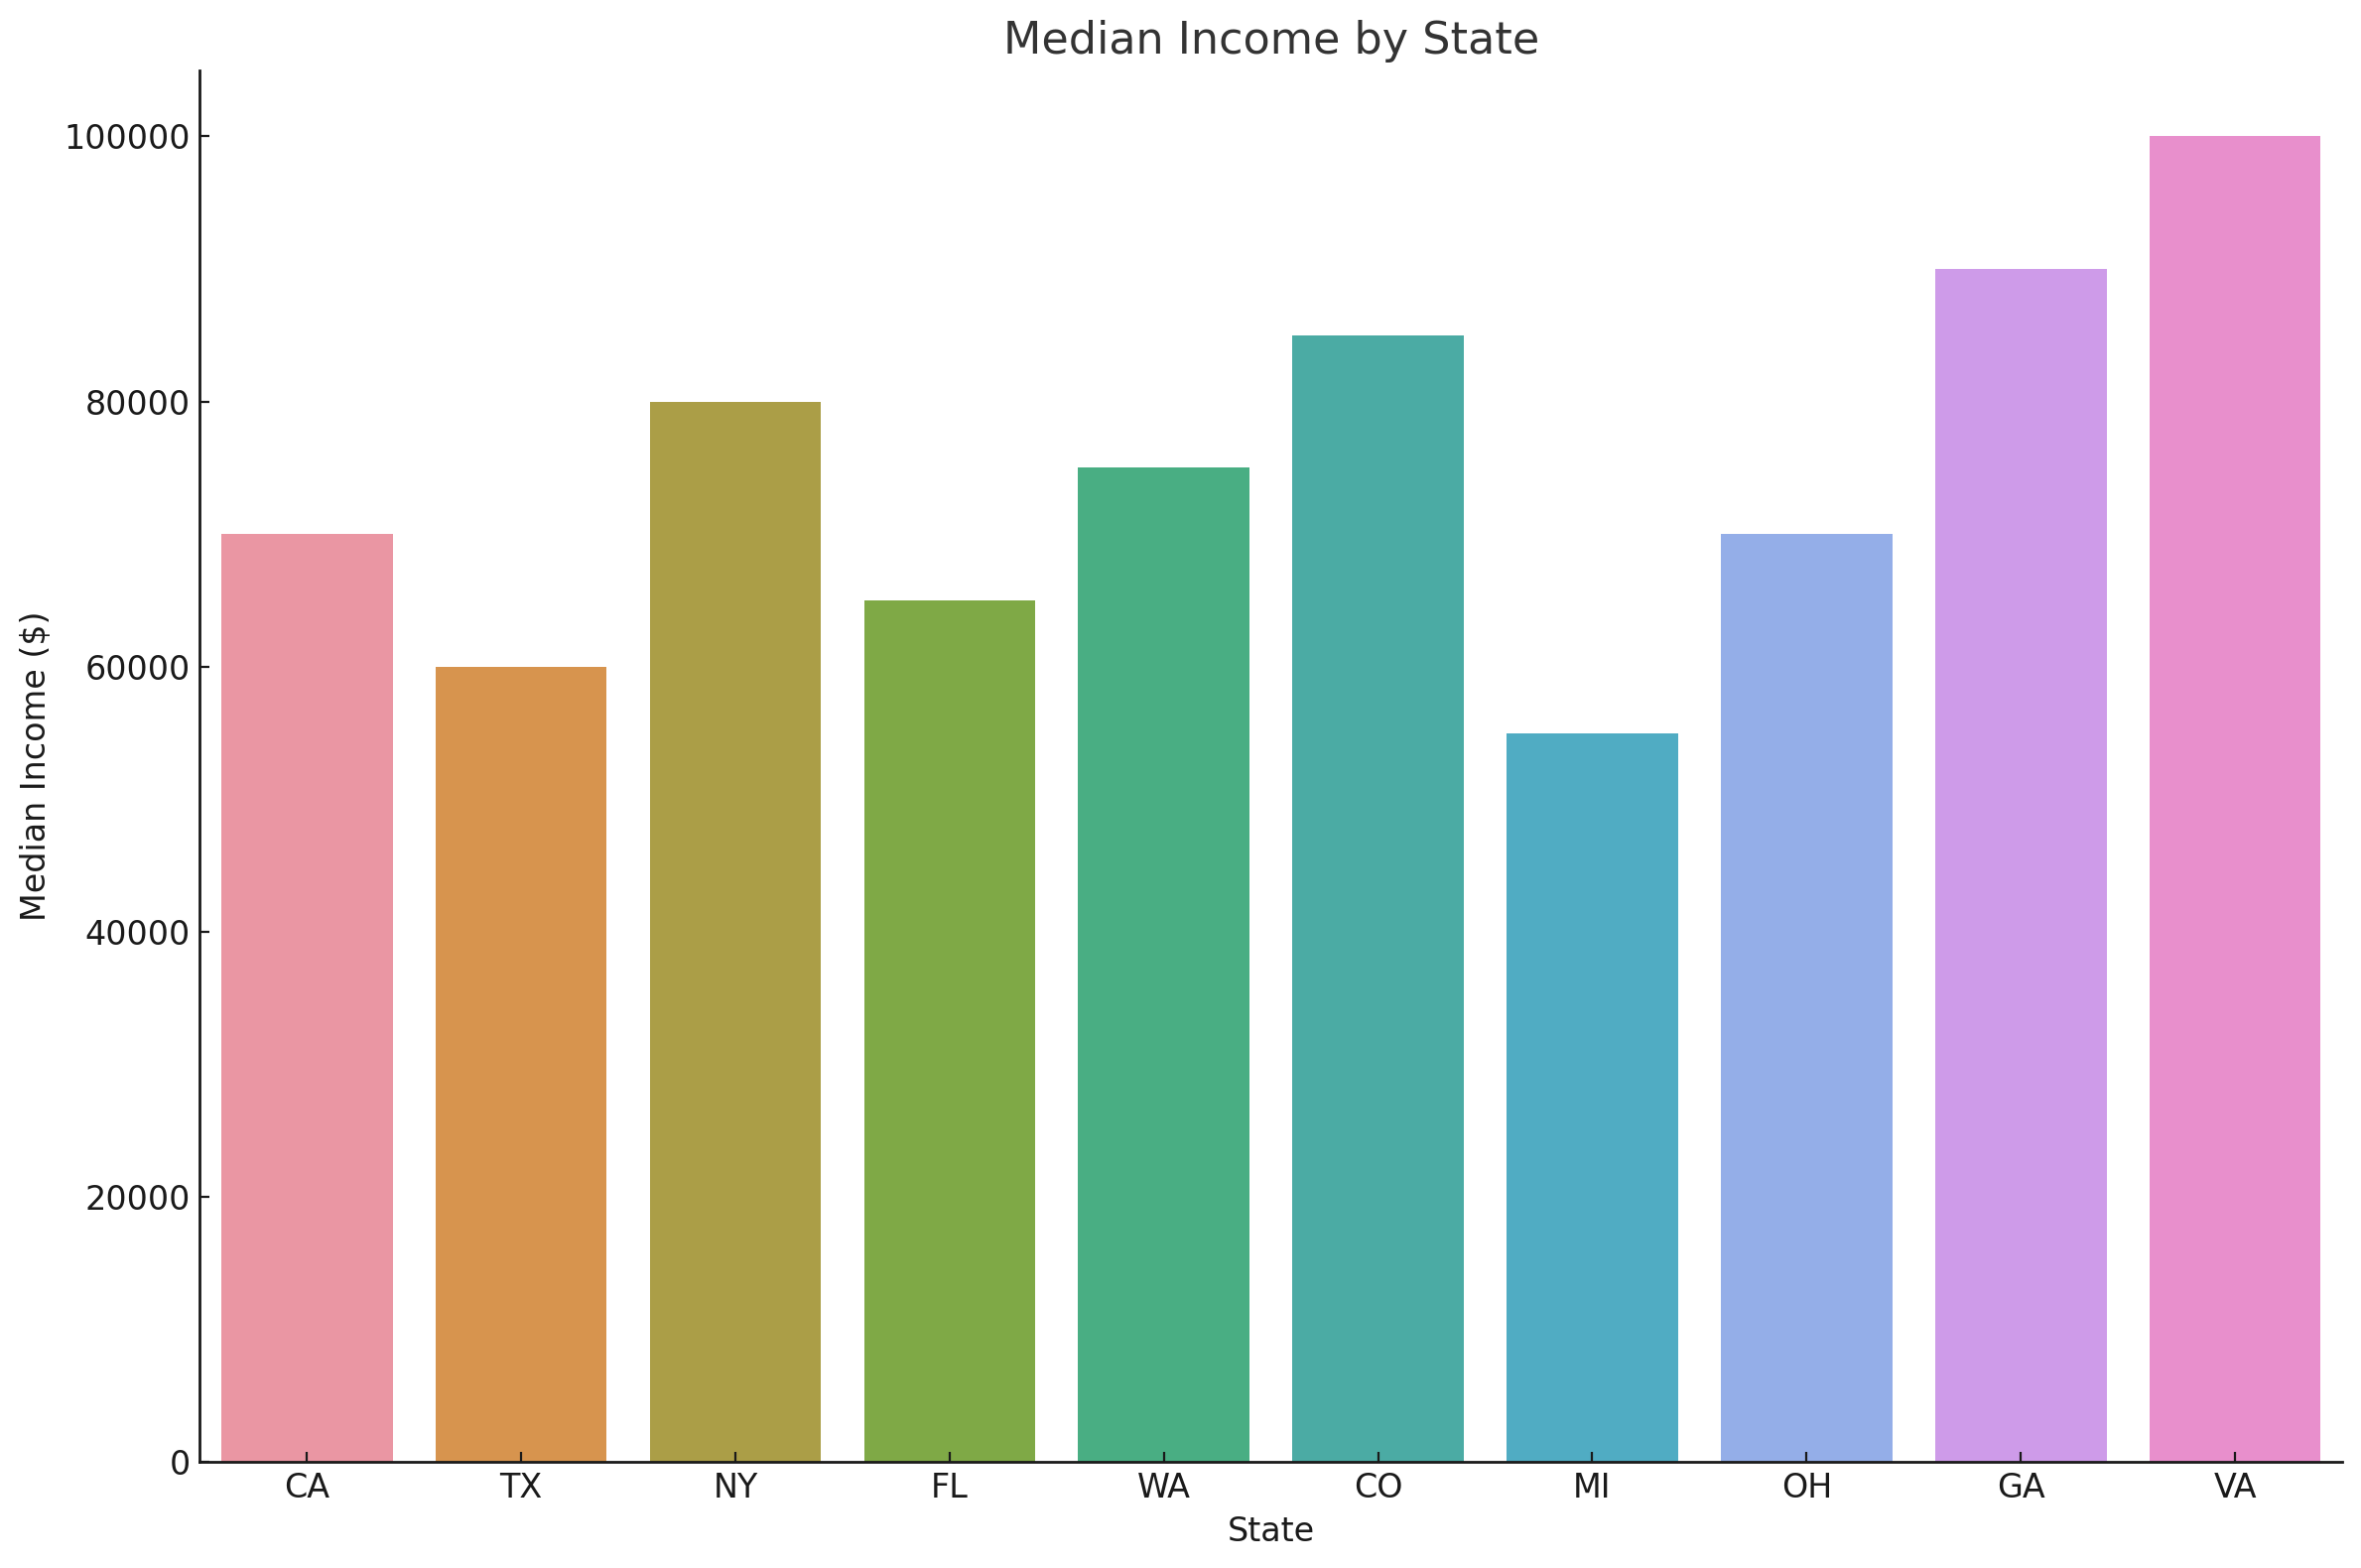
Here's the bar chart visualizing the relationship between "state" and "median_income" for the cities listed in the table. This chart provides a clear comparison of the median incomes across different states from your dataset. If there's anything more specific you need or another analysis you'd like to perform, please feel free to let me know!


Here's the bar chart visualizing the relationship between "state" and "median_income" for the cities listed in the table. This chart provides a clear comparison of the median incomes across different states from your dataset. If there's anything more specific you need or another analysis you'd like to perform, please feel free to let me know!
|
||

{{xyzcomments.commentsCount}} Comments
{{xyzcomments.pageViewsCount}} Views
{{xyzcomments.sharesCount}} Shares
{{xyzcomments.followerCount}} Subscribers
Loading images ...
{{xyzcomment.NickName}}
{{xyzcomment.MarketType}}
{{xyzcomment.ProductTitle}}Price:${{xyzcomment.Price}} |
{{xyzcomment.NickName}}
|
|
|
|
|
|
|
|
|
|
|
|