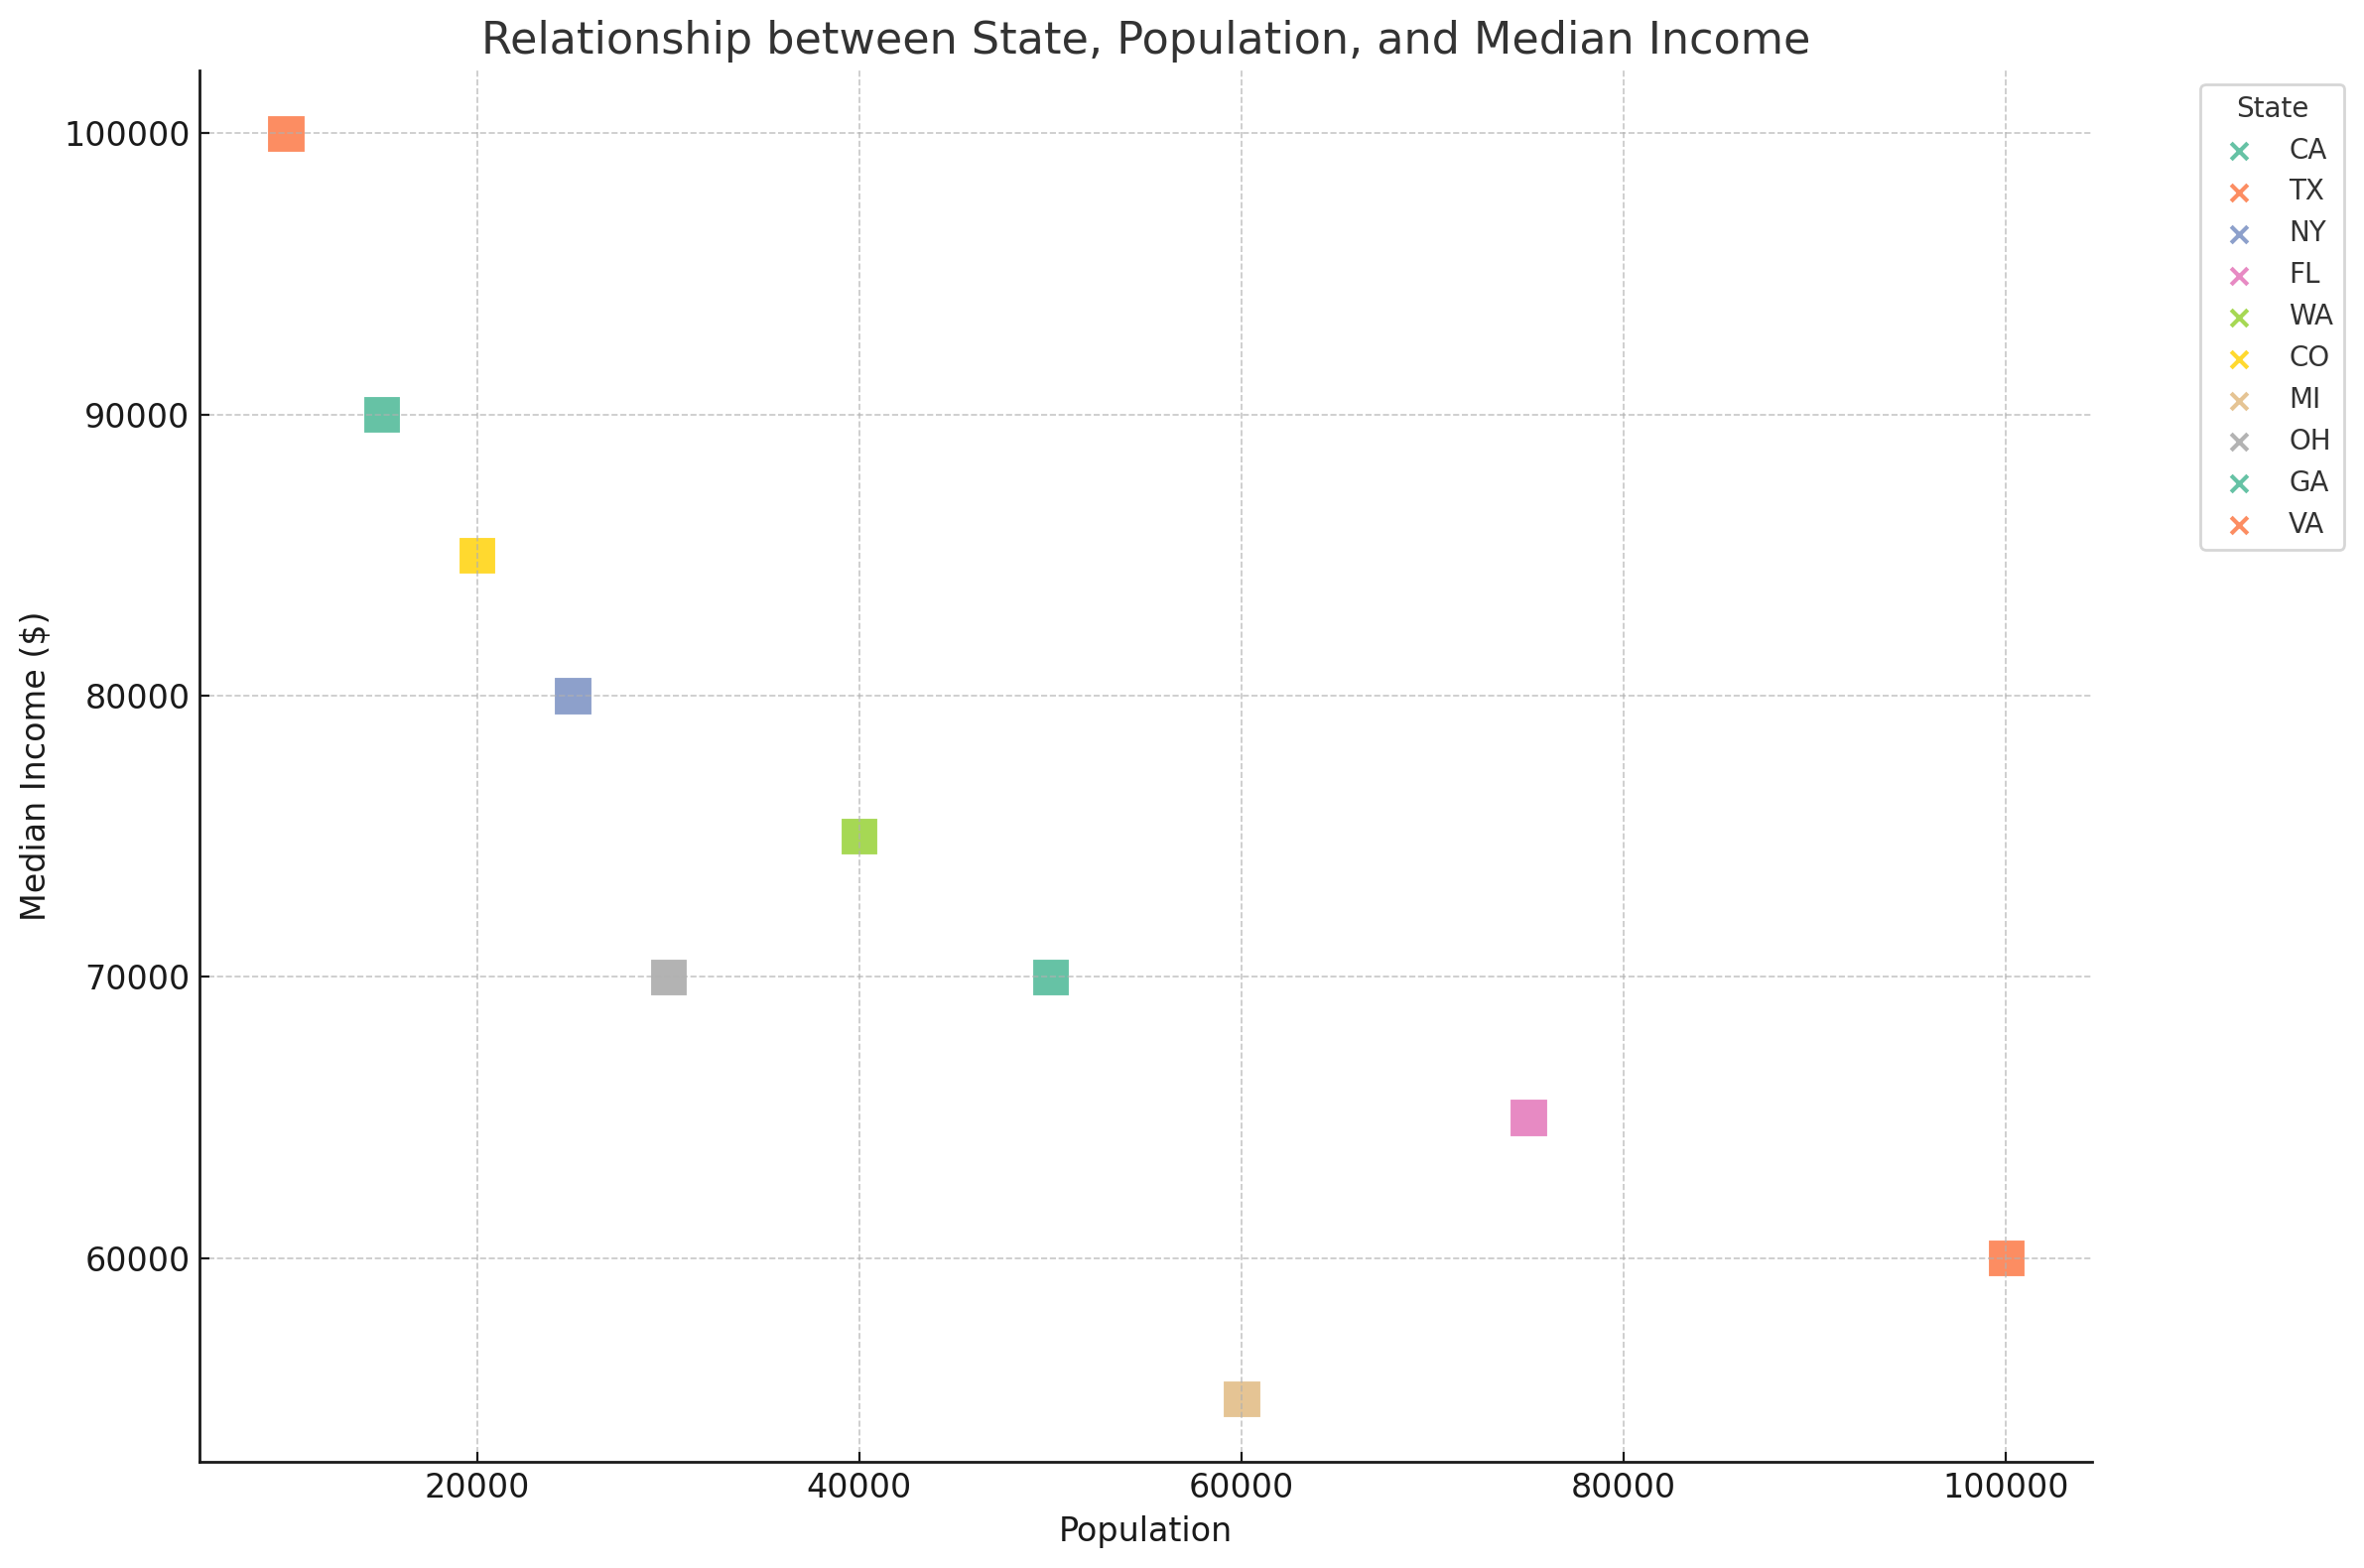
Here is the updated scatter plot with larger square markers, making it easier to observe each city's position in relation to its population and median income, and differentiated by state. If there are any other adjustments or further analyses you need, please feel free to ask!


Here is the updated scatter plot with larger square markers, making it easier to observe each city's position in relation to its population and median income, and differentiated by state. If there are any other adjustments or further analyses you need, please feel free to ask!
|
||

{{xyzcomments.commentsCount}} Comments
{{xyzcomments.pageViewsCount}} Views
{{xyzcomments.sharesCount}} Shares
{{xyzcomments.followerCount}} Subscribers
Loading images ...
{{xyzcomment.NickName}}
{{xyzcomment.MarketType}}
{{xyzcomment.ProductTitle}}Price:${{xyzcomment.Price}} |
{{xyzcomment.NickName}}
|
|
|
|
|
|
|
|
|
|
|
|