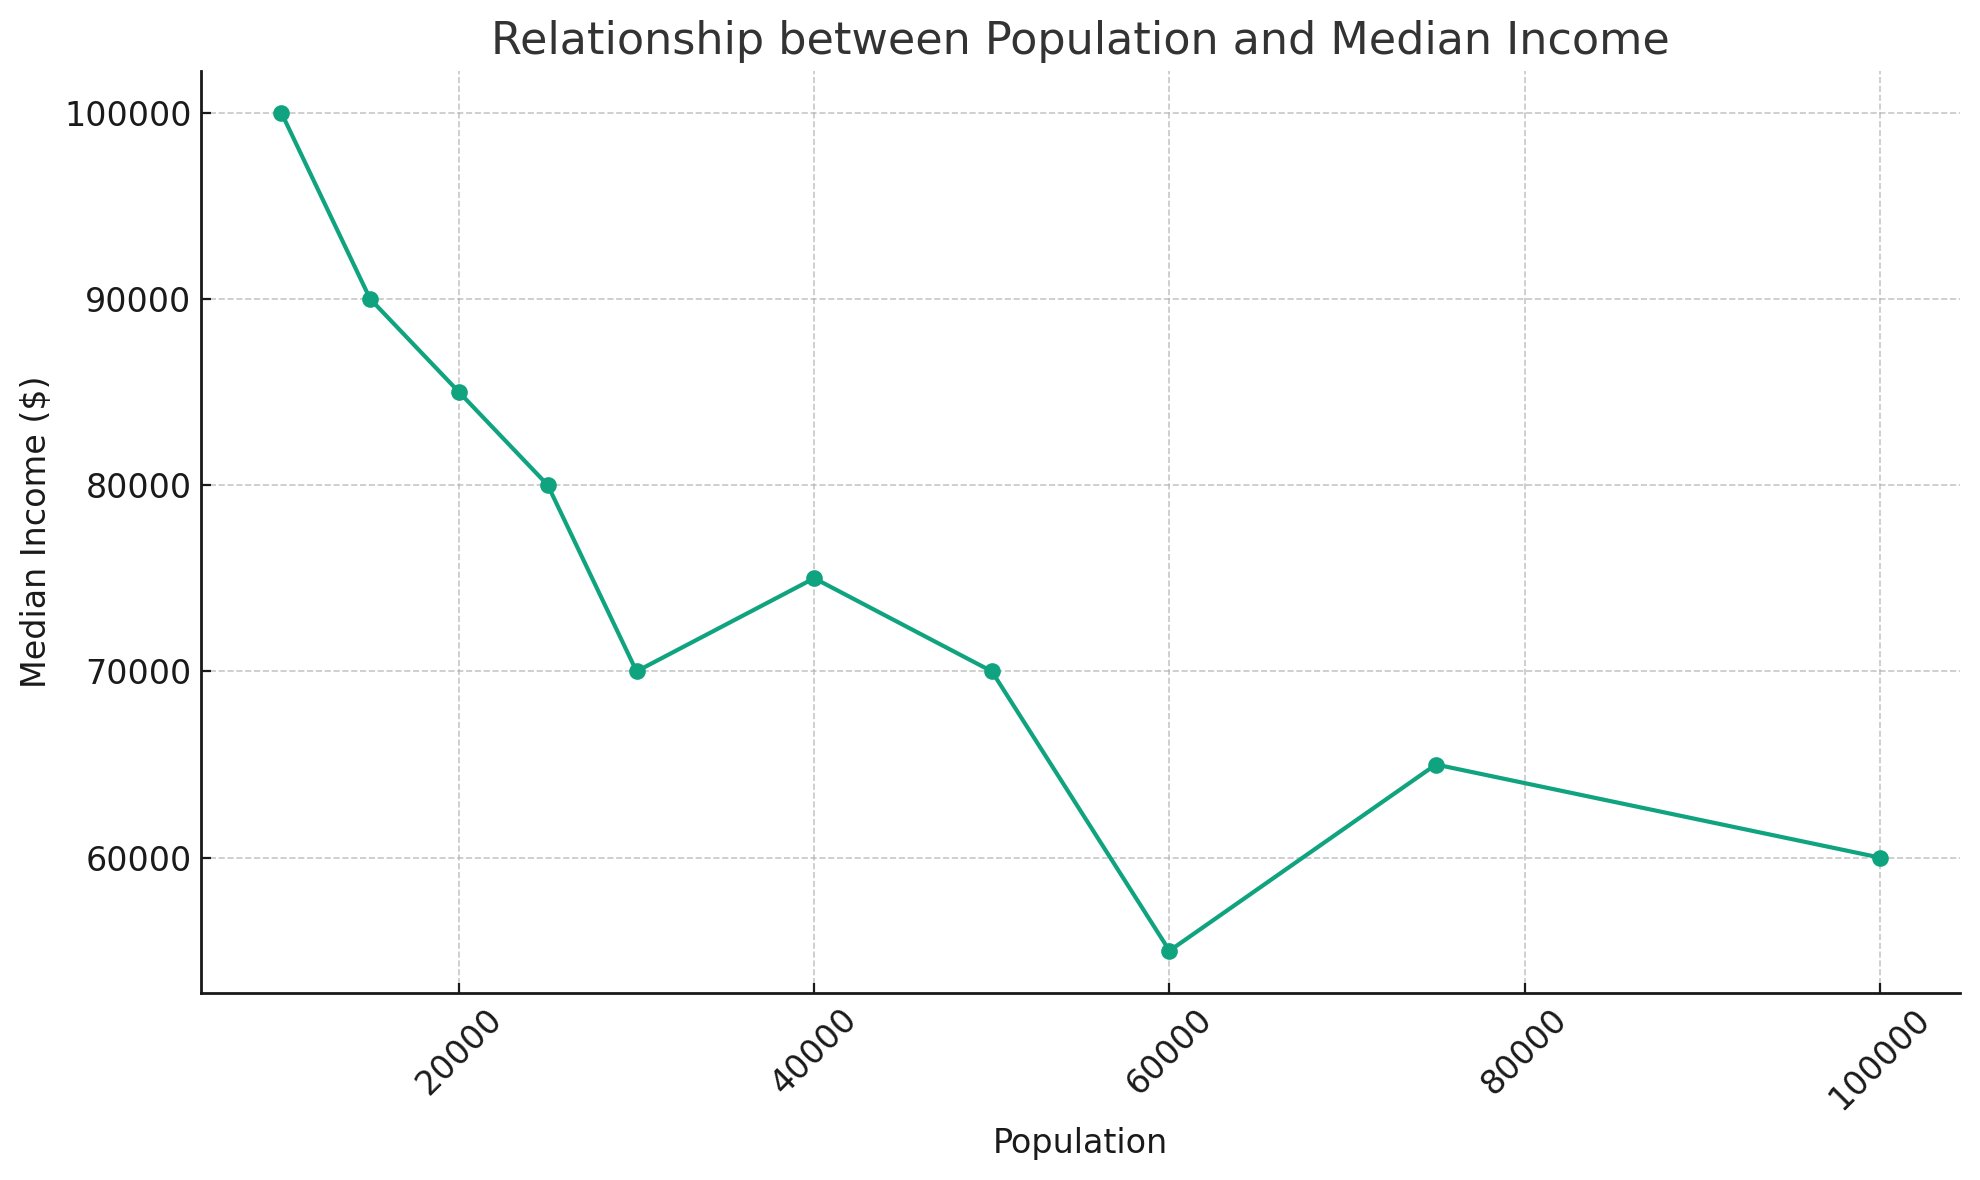
Here's the graph visualizing the relationship between "population" and "median_income" for the cities listed in the table. As shown, the line graph represents the median income in relation to the population size, ordered by increasing population. Is there anything else you'd like to explore or another way you'd like this data visualized?


Here's the graph visualizing the relationship between "population" and "median_income" for the cities listed in the table. As shown, the line graph represents the median income in relation to the population size, ordered by increasing population. Is there anything else you'd like to explore or another way you'd like this data visualized?
|
||

{{xyzcomments.commentsCount}} Comments
{{xyzcomments.pageViewsCount}} Views
{{xyzcomments.sharesCount}} Shares
{{xyzcomments.followerCount}} Subscribers
Loading images ...
{{xyzcomment.NickName}}
{{xyzcomment.MarketType}}
{{xyzcomment.ProductTitle}}Price:${{xyzcomment.Price}} |
{{xyzcomment.NickName}}
|
|
|
|
|
|
|
|
|
|
|
|