

Real AI 地产助手
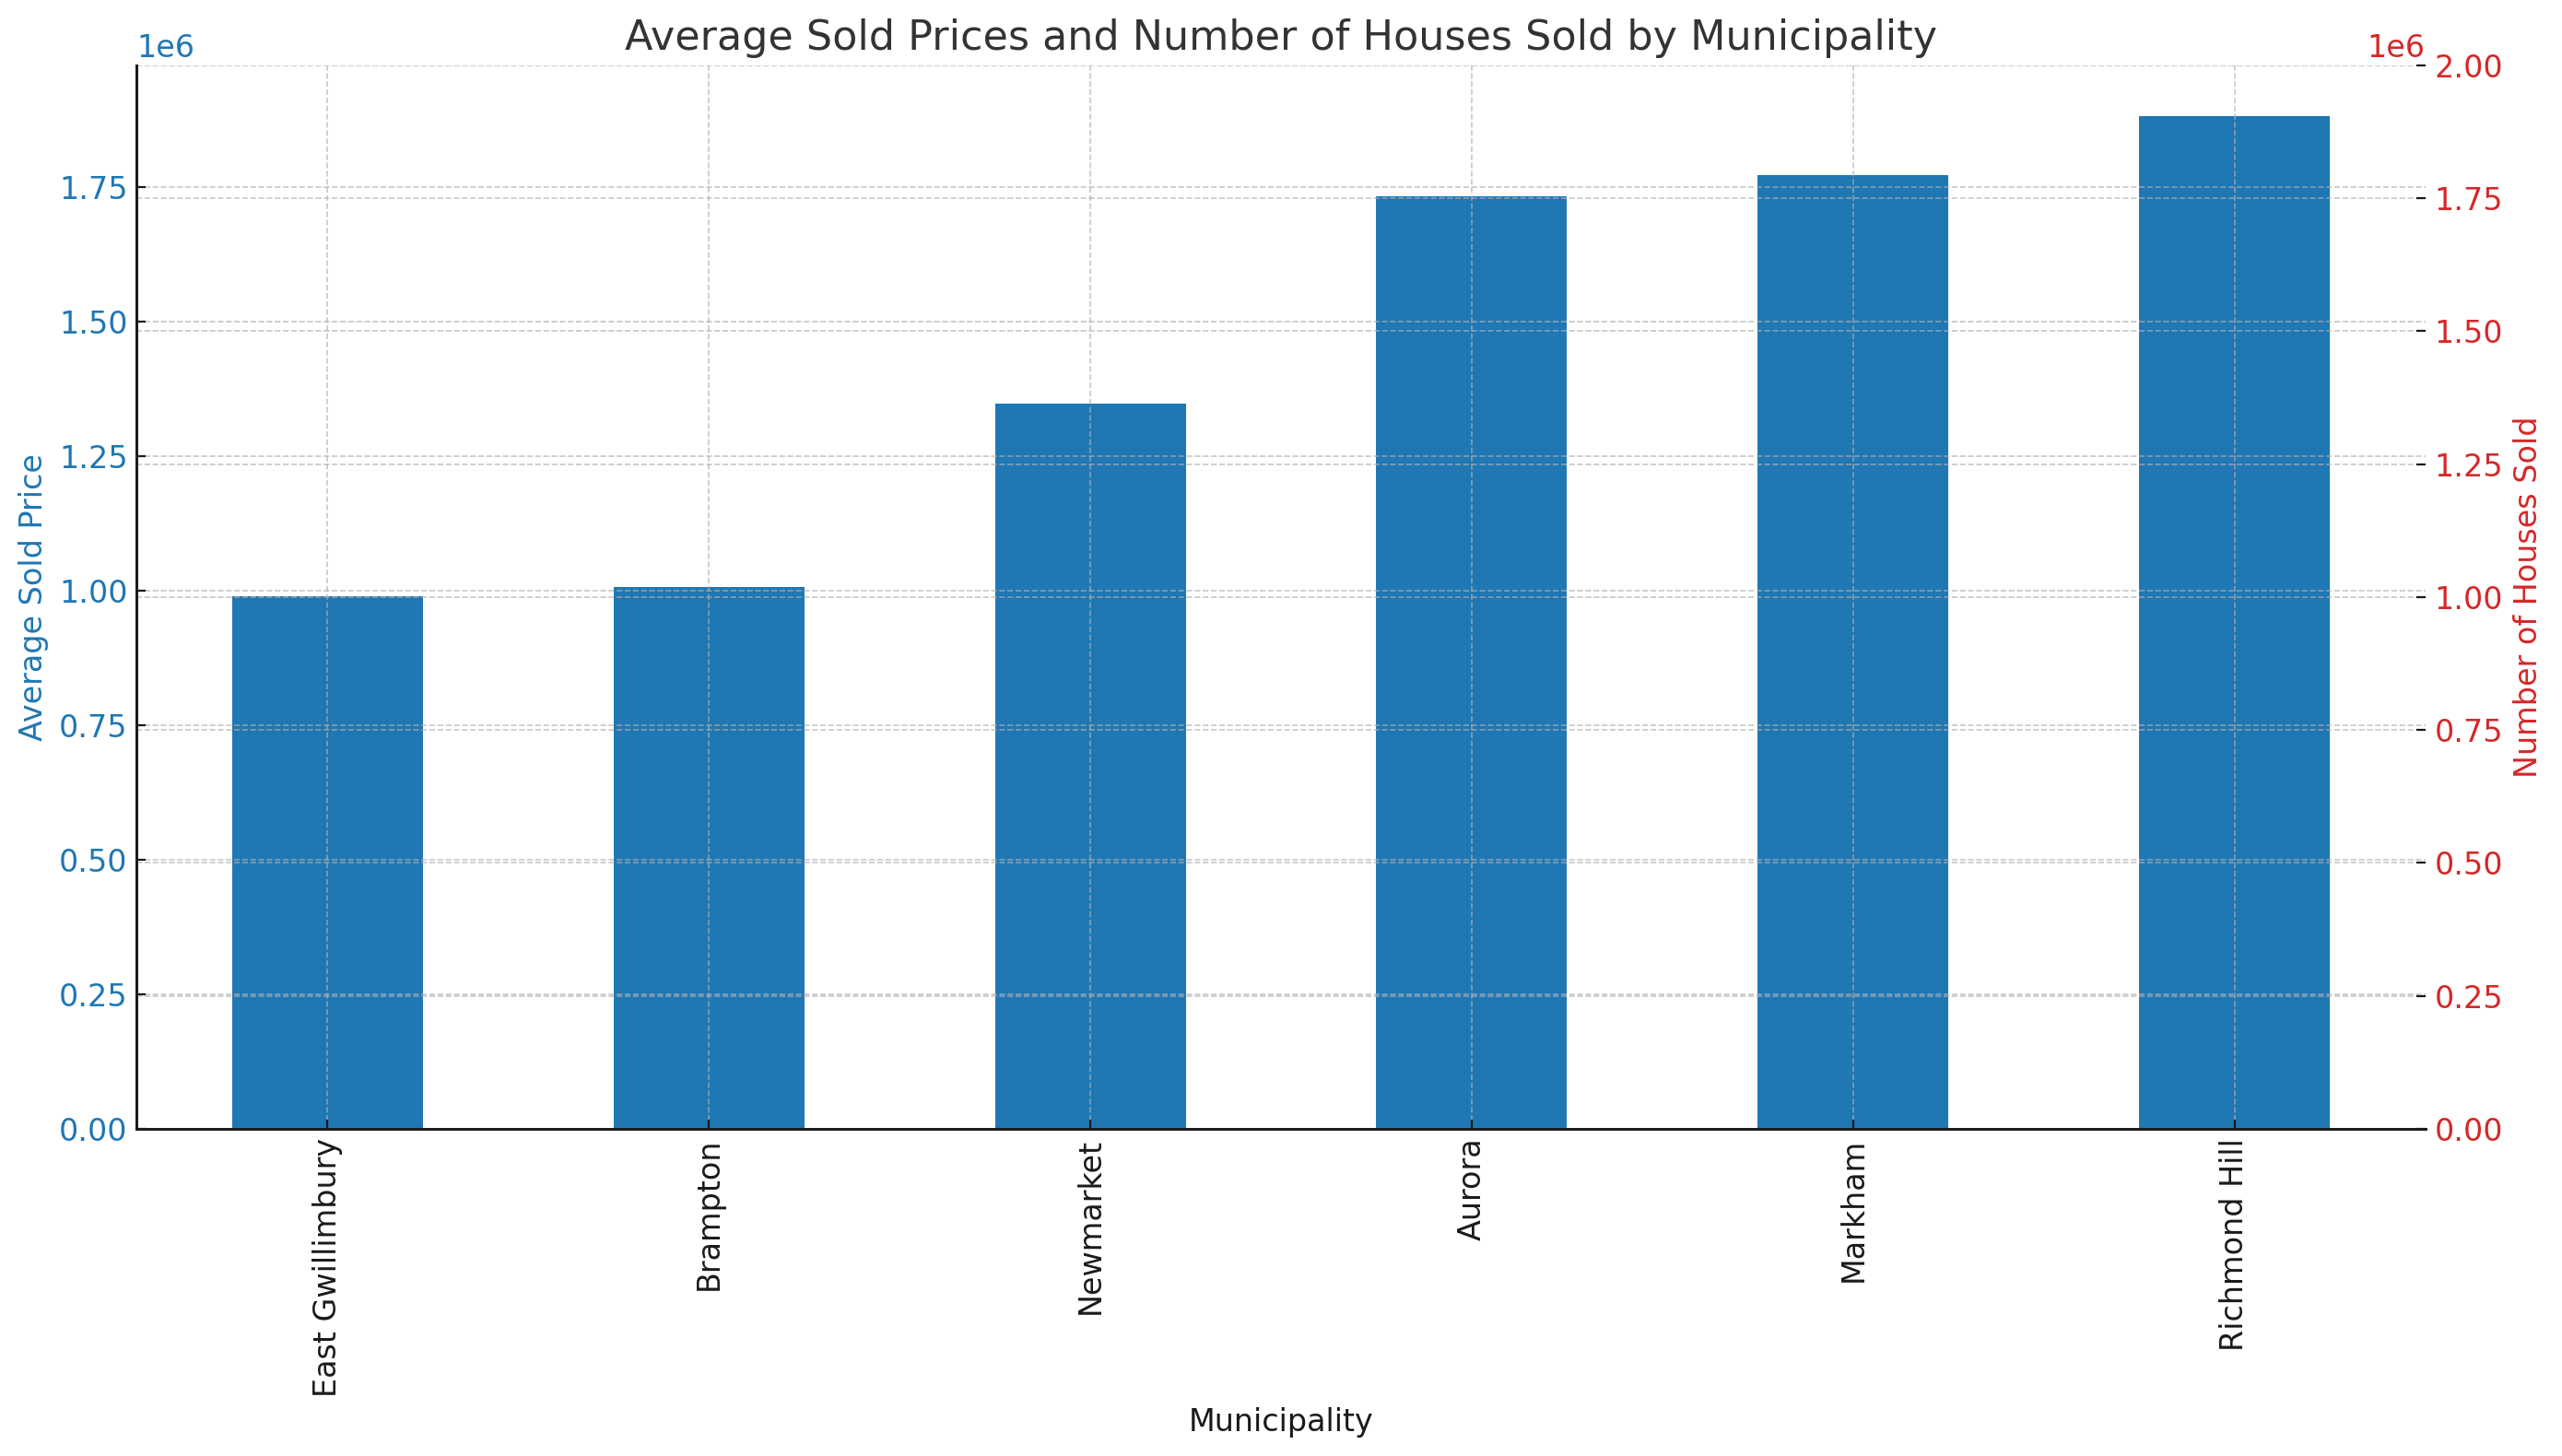
Here is the updated bar chart showing the average sold prices (in blue) and the number of houses sold (in red) for each municipality. The y-axis is capped at 2 million dollars. Let me know if you need any more modifications or information!
|
||

Loading images ...